Learn all about the popular use of Gantt charts in project management and how you can create your own chart at monday.com
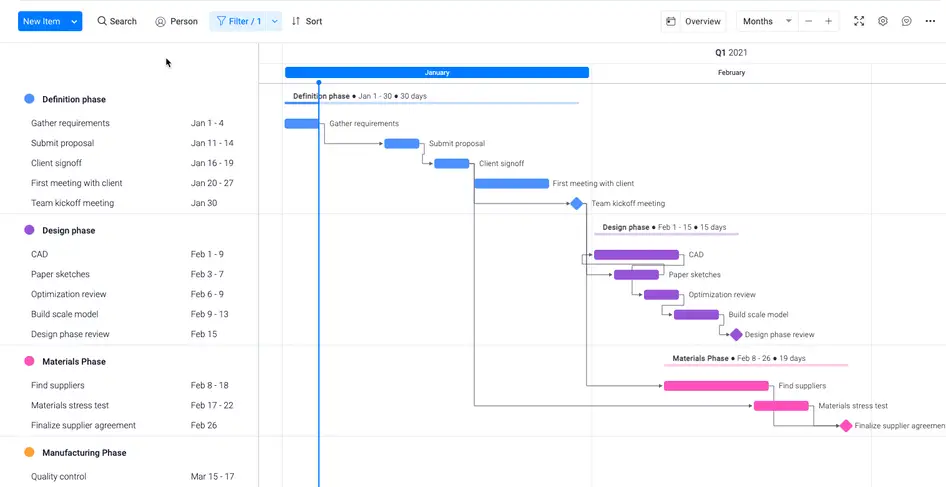
A Gantt chart is a bar chart for visualising project tasks over time. Each bar represents a task, with the data lying horizontally. These diagrams show project schedules and task dependencies and are known for their visual clarity and effectiveness. They are a classic tool for visualising activities and their interrelationships;
What is a Gantt chart used for?
A Gantt chart shows deadlines, milestones and project progress. It clarifies tasks and their impact on the overall project and can be used in a variety of ways. Below you will find some ways in which they can be useful for different goals or projects:
-
- Simplify complex projects and help track KPIs
- Can support resource management when planning marketing campaigns
- Enables a visual understanding of the scope and requirements of a project
- Managers can use them as a guide to track project progress
Gantt charts support companies in creating a Work Breakdown Structure (WBS) and make large goals manageable. While a work breakdown structure defines the tasks, a Gantt chart shows the timing and duration of each task; A marketing team can use it to coordinate campaigns and tasks such as social media and branding, allowing each member to clearly see project progress and status. It promotes effective planning and time estimation.
Pert chart vs. Gantt chart
PERT diagrams show tasks in a network diagram with nodes and arrows to visualise dependencies; Gantt charts focus on planning and tracking the progress of the project. While PERT emphasises the dependencies and critical path in complex projects, Gantt charts provide flexibility during project execution; Both can be used in a project, but PERT is more suitable for the planning phase and Gantt for the implementation.

Source: monday.com
What are the components of a Gantt chart?
Even though every team’s Gantt chart looks different depending on the workflow and critical path, there are six important components that should definitely be included:
-
-
- Dates/Times: Gantt charts show task dates from start to finish as well as their position on the overall project timeline to make planning easier.
- Tasks and their bars are displayed in the required order. Tasks are listed vertically on the left, with their bars on a time axis representing the dependencies and project duration.
- Milestones are prominent points in a Gantt chart and indicate important project phases. Progress is tracked in relation to these milestones, often with a percentage of completion of the current task.
- Dependencies: Arrows or lines are used to show which tasks are dependent on each other.
- Vertical markers in the diagram show current data and the progress of a project as well as the remaining workload.
- Resources: Some tasks contain resources such as tools, documents or contacts that are helpful in completing a task.
-
How to create a Gantt chart on monday.com
To create a Gantt chart, tasks must be recorded, dependencies defined and a timeline created. It’s easier to do this with a project management platform like “monday work management” with integrated Gantt views.
How to display your tasks in a Gantt chart with monday work management
monday work management offers 27 project views, including a Gantt chart. Instead of creating a chart from scratch, you can customise your workbook with parameters and automations and then simply display it as a Gantt chart. This is how it works:
-
-
- Make sure that your table has a timeline column and a dependency column.
- Select the Gantt option in the Board view menu.
- Your tasks are now organised in a Gantt chart, and you can get more creative with on-the-fly edits and cool features like the Gantt baseline, which allows you to visualise the current project progress against the planned timeline.
-
In monday work management, you can customise the Gantt view as required. Add them to the dashboard as a widget, determine displayed columns and sort elements by groups such as project phases. You can add labels or colours with visual adjustments. The chart can be customised over time, from days to years, to see detailed tasks or the big picture.
With monday.com you don’t have to switch between Gantt and board view. You can update your project directly in the Gantt view, giving you a flexible.
The advantages and disadvantages of using a Gantt chart in project management
Advantages:
Project managers use Gantt charts because they simplify teamwork and the updating of project tasks. Let’s take a look at some of the benefits of using a Gantt chart in project management:
-
- Gantt charts help teams understand the critical path by showing the dependencies between tasks
- Project managers can allocate resources more efficiently by viewing the start and end date of each task and recognising resource and scheduling conflicts.
- Gantt charts provide team members with a clear and visual representation of a project and its timeline so that everyone can quickly understand the overall schedule.
- Track the progress of multiple tasks and compare them to the planned schedule to identify potential delays or bottlenecks and improve time management;
- Ownership of tasks becomes clearer as team members are assigned tasks and know their responsibilities and deadlines.
- By visualising task dependencies and critical paths, project managers can identify potential risks and take appropriate action.
- Gantt charts facilitate communication with team members, clients and stakeholders and help manage expectations while providing a clear overview of project progress.
Disadvantages:
Gantt charts offer many advantages, but are not always ideal for every team or project. They also have disadvantages that should be taken into account when using them. However, these can be avoided through careful planning, implementation and team communication.
Some disadvantages you should be aware of are:
-
- Gantt charts can become complex and difficult when it comes to larger and more detailed projects with many tasks.
- Maintaining an up-to-date Gantt chart can be tedious and time-consuming when changes occur.
- Without careful management of resources, Gantt charts can overload team members with multiple tasks.
- Some Gantt charts may not contain all the necessary information for tasks, such as descriptions or required resources, leading to delays;
Tools such as monday work management enable project management with Gantt charts and avoid their disadvantages through automation and communication tools. However, Gantt charts are not ideal for all projects, and depending on team size, schedule and project type, an alternative visualisation may be more appropriate.
Alternatives to Gantt charts
Gantt charts are useful for many projects, but not always the best choice for every team. There are various project management diagrams and tools with different approaches to project visualisation.
Some popular alternatives are:
-
- Kanban board: Kanban boards use cards to represent tasks and columns for workflow stages. Team members move cards between columns according to task progress to keep track of status and workflow.
- Scrum board: Scrum boards are used for agile project management and visualise user tasks from a backlog, displaying their progress in different phases during sprints.
- Schedule diagram: Project schedule diagrams show linear representations of tasks and events over a period of time and, despite being less detailed than Gantt charts, provide a quick overview of project milestones.
- Project checklist: Project checklists are simple and customisable, with no learning curve. They can be used independently or together with other diagrams and boards.
It can be useful to use different project views. With platforms such as monday work management, there are over 27 views available so that you can flexibly use different project management diagrams.
Conclusion
Start by creating your own Gantt charts, they are very helpful for project visualisation. You can optimise team processes with software such as monday work management. This offers advanced functions such as various views, automations, integrations and filter options. For a robust Gantt chart and project management, monday.com could be ideal.
